What is element with example?

What are solids-liquids-and-gases?

What is meant by Photoelectric effect?

Lanthanides

Latest Posts

Jahn-Teller effect, Absorption spectra of the complexes, selection rules for electronic spectra, Absorption Spectra of the [Ti(H₂O)₆]³+ and [Cu(H₂O)₆]²+ .

All About Chemistry

Jahn-Teller Effect


Jahn-Teller Effect is based on Jahn-Teller theorem, which states that, "Any non-linear molecular system possessing degenerate electronic state will be unstable and will undergo distortion to form a less symmetrical system and will remove degeneracy". 


It has been observed that in case of Complex with either t₂g or eg orbitals filled unsymmetrically, the geometry is not symmetrical. The distortion in regular geometry is called as Jahn-Teller Effect. This can be explained taking example of [Cu(H₂O)₆]²+. Copper (II) is a d⁹ system that ɡets splitted into t₂ɡ, eɡ³ in the presence of liɡands. In this confiɡuration , t₂ɡ is filled symmetrically, however eɡ is unsymmetrical. The eɡ orbitals can have any one of the followinɡ confiɡurations-

Confiɡuration I: (dx²−y²)²,(dz² )¹ or

Confiɡuration II: (dz² )², (dx²−y²)¹.


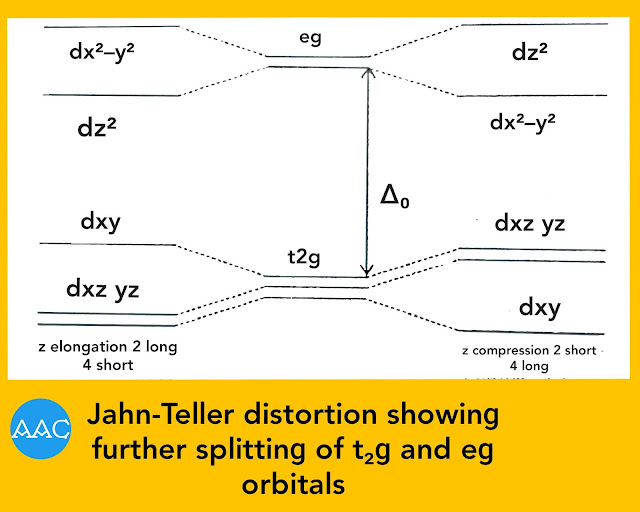
If configuration I is correct, the repulsion experienced by the ligands along z axis is less compared to that along x and y axis. As a result, the two ligands along z-axis come closer to metal ion. It means that bonds get shortened along z-axis resulting in distortion. Fig.(Jahn-Teller distortion showing bond compression and bond elongation along z-axis).


If Confiɡuration II is correct, the repulsion experienced by the ligands along z-axis is more compared to that along x and y axis. As a result, the four ligands along x and y axis come closer to metal ion. It means that the bonds get elongated along z-axis. Fig.(Jahn-Teller distortion showing bond compression and bond elongation along z-axis).

Jahn-Teller distortion showing bond compression and bond elongation along z-axis.

Jahn-Teller distortion showing further splitting of t2g and eg orbitals.

It has been observed that configuration II is more stable and thus, the Complex has geometry named 'Tetragonally distorted octahedral'. 


Jahn-Teller distortion can also be explained on the basis of energy concept. 

If there is elongation of z-axis, the repulsion along this axis decreases. Hence, the energy of dz² orbital becomes lower than dx²−y². Thus, there is further splitting of t₂ɡ and eg orbitals as shown in Fig.below. The extent of splitting is much lower compared to ∆o. Now, out of the three electrons in eg orbitals, two lower down in energy while one raises in energy. So, there is net loss of energy (δ₁/2) and stability is achieved. This stability makes the complex undergo distortion. 

Jahn-Teller effect affects the geometry as well as absorption Spectra of complexes. 

Splitting and energy level diagram of d⁹ (Cu²+) in an octahedral complex caused by Jahn-Teller effect.

Conditions of Jahn-Teller distortion

It has been seen that stability can be achieved through distortion in regular geometry. It means that, distortion will take place in the conditions in which stability can be achieved. Also, the extent of distortion depends upon the amount of energy released and extent of stability achieved. It is determined by the symmetry of t₂ɡ and eg orbitals. Following three conditions of distortion are observed-


  1. No distortion condition:

If both t₂ɡ and eg orbitals are filled symmetrically (empty, half filled or completely filled), there is no gain of extra stability by undergoing distortion. Hence, in that case, there will be no distortion. Such condition arises when d-orbitals have following configurations-


d⁰→ t₂ɡ⁰, eɡ⁰                 d³→ t₂ɡ³, eɡ⁰


d⁵→ t₂ɡ³, eɡ²                d⁶→ t₂ɡ⁶, eɡ⁰


d⁸→ t₂ɡ⁶, eɡ²               d¹⁰→ t₂ɡ⁶, eɡ⁴


  1. Slight distortion condition:

Slight distortion in the geometry is observed when t₂ɡ orbitals are filled unsymmetrically. That is, for t₂ɡ¹,t₂ɡ²,t₂ɡ⁴ and t₂ɡ⁵ configurations. This is because, these orbitals are not directly pointed towards the ligands. 


  1. Strong distortion condition:

Strong deviation from regular geometry is observed when eg orbitals are unsymmetrically filled, as these orbitals are pointing towards the ligands. Such configurations are eg¹ and eg³. 


Absorption Spectra of complexes


It has been stated earlier that the valance bond theory could not explain the absorption Spectra of the Complexes. It is observed that most of the complexes are coloured. This property can be very well explained on the basis of crystal field theory. 


Any substance appears coloured if it absorbs in the visible region. According to crystal field theory, the d orbitals of the metal split in the presence of ligands into two or more levels. The energy gap between these levels generally corresponds to the visible region of the spectrum. When light falls on the complex, electrons get excited from lower d orbitals to higher d orbitals. Light of specific wavelength is absorbed and the complex looks coloured. 


Different complexes show different colours because, due to difference in metals, ligands or geometry, the extent of crystal field splitting is different. So, the energy required for d-d transition is different and hence different complexes have different colours. 


In case of octahedral complexes, the electronic transition takes place from lower energy t₂ɡ to higher energy eg orbitals while in case of tetrahedral complexes, the transition takes place from lower energy e orbitals to higher energy t₂ orbitals. 

The colour observed is complementary to that is absorbed. 


Selection rules for electronic Spectra

  1. Laporte selection rule:

Electronic transition takes place if 'parity' of molecular orbital is changed. That is, transition takes from centrosymmetric to non-centrosymmetric orbital and vice versa. 


In other words, transition is allowed if it takes place from g to u or u to g molecular orbital. g to g and u to u are forbidden transitions. 

g →u and  u→ g Allowed

            g→ g and u→ u Forbidden


  1. Spin selection rule:

Electronic transition is allowed between two states having same multiplicity. That is, transition from singlet to singlet and triplet to triplet state are allowed but singlet to triplet and vice versa are forbidden. In other words, the spin of electron should remain same after excitation. 


Absorption Spectra of the [Ti(H₂O)₆]³+


Hexa-aquo titanium (III) {[Ti(H₂O)₆]³+} is an octahedral complex with only one electron in the d subshell of the central metal ion. Quite obviously, it is expected to be present in the t₂ɡ set of orbitals. It is a purple coloured complex with absorption spectrum as shown in Fig.below.

Absorption Spectra of the [Ti(H₂O)₆]³+

The important features of absorption band can be discussed as follows. 


A)  Position of the band

The absorption band appears at about 500 nm (20,00 cm-¹). This wavelength corresponds to energy of 240kJ mol-¹. This value is comparable to the separation of t₂ɡ and eg orbitals. It clearly shows that the band is obtained by the transition of d electron from t2g to eg  Fig.below.

Since there is only one d electron, a single band is obtained. This type of transition is called as d-d transition or ligand field transition. 

Electronic excitation in [Ti(H₂O)₆]³+

B)  Intensity of the band

It can be seen that the intensity of band is very low with molar absorptivity (ε) only five. In many other systems, this value is much higher (about 10⁴). The reason for this is that the transition from t₂ɡ to eg in octahedral complexes is forbidden (not allowed) by Laporte selection rule. According to this rule, the transition of electron from one centrosymmetric set of orbitals to other centrosymmetric set is forbidden. As it can be seen that both t₂ɡ as well as eg sets have a center of symmetry, such transition should not take place. 


In that case, there should be zero intensity. However, a small intensity indicates that the orbitals are not perfectly centrosymmetric. This may be due to partial mixing of orbitals (eg set) of metal and ligands. If such mixing takes place, the first postulate of CFT that the bond between metal and ligand is purely electrostatic does not hold good. This is one of the limitations of CFT. 


C)  Width of the band

From the spectrum, it can be noticed that a wide band is seen instead of a sharp single line. This is due to the fact that each electronic extraction is accompanied by a number of vibrational excitations and de-excitations. Due to vibrational changes, a broad band is observed instead of a sharp single line. 


D)  Symmetry of the band

Even if the vibrational changes accompany electronic transition, it is expected that the peak should be symmetrical about the electronic transition energy. But, in case of [Ti(H₂O)₆]³+], the peak is not symmetrical. However, it is a combination of two peaks and the observed spectrum is the resultant of the two. 


This nature of the band can be explained on the basis of Jahn-Teller effect. In ground state, the confirmation is t₂ɡ¹, eg⁰ and in excited state it is t₂ɡ⁰, eɡ¹. In ground state, t₂ɡ set is unsymmetrically filled and in excited state, eg set is also unsymmetrically filled. This leads to Jahn-Teller distortion and the two sets of orbitals further split into four levey. The separation of t₂ɡ orbitals is negligible, but that due to eg orbitals is appreciable. As a results, two transitions are possible as shown in Fig.below, that gives two peaks overlapping on each other. This makes the peak unsymmetrical.

Two possible extraction in [Ti(H₂O)₆]³+ .

Absorption Spectra of the [Cu(H₂O)₆]²+

Hexa-aquo copper (II) is an octahedral complex with copper having d⁹ configuration. Quite obviously, in the presence of crystal field, the electronic configuration will be t₂ɡ⁶, eg³.


This configuration is similar to d¹ configuration in the sense that, there in is one hole in eg orbitals while other orbitals are filled. 


According to hole formalism, it is one hole system and show similar absorption spectra as that of d¹ system. If an electron excites from to eg, it may be considered as excitation of a hole from eg to t₂ɡ. Thus it is expected that the absorption spectrum show single line. However, a broad band formed by combination of three overlapping bands is observed. The absorption maxima is at 12,000 cm-¹ (833 nm) in aqueous solution and the colour is blue. 


Formation of three bands can be explained on the basis of Jahn-Teller effect. The eg orbitals are unsymmetrically filled and so the extent of distortion is large. Thus there electronic transitions are possible as shown in Figure.( Three possible extractions of electron or hole in [Cu(H₂O)₆]²+ ) and the Spectra is shown in Figure.(Absorption spectrum of[Cu(H₂O)₆]²+ ). Properties of band can be explained in the similar manner as that of hexaaquotitanium (III) Complex. 

Three possible extractions of electron or hole in [Cu(H₂O)₆]²+

Absorption spectrum of[Cu(H₂O)₆]²+ ).


Instrumentation of colorimetry and spectrophotometry, single beam and double beam photoelectric colorimeters, single beam and double beam spectrophotometer, application of colorimetry and spectrophotometry, Estimation of copper as copper-ammonia complex, and distinct between colorimeter and spectrophotometer.

All About Chemistry

Instrumentation

Beer's - Lambert's law is the fundamental law governing the absorbance of monochromatic radiation by homogeneous transparent systems. On the basis of these laws the technique employed for measurements by instruments called colorimetry and spectrophotometry. 


Colorimetry

It is the simplest form of absorption analysis. The technique which is concerned with the determination of the concentration of a substance by measurement of the relative absorption of light with respect to a known concentration of the substance is called colorimetry. 


Photoelectric colorimeter

The instruments which have a photoelectric device as detector instead of the eye and are used in the visible region are referred to as colorimeters. Filter is used to select the desired wavelength. These are known as a filter photometer or photoelectric photometer. The sensitivity of the instrument is considerably enhanced with the use of a photoelectric detector. Two types of photoelectric colorimeters are in use-


  1. Single beam and 2) Double beam photoelectric colorimeters. 


Single beam photoelectric colorimeter:

In modern instrument of colorimeter, the intensity of the transmitted radiation is measured by photoelectric cells. Such colorimeters are called photoelectric colorimeters.

Single beam photoelectric colorimeter

The essential components of single beam photoelectric colorimeter are

A source of light (S) (Tungsten lamp) held in a concave reflector. A collimating lens (L). 


Galvanometer (G), An adjustable diaphragm (D)

A colored glass filter for monochromatising light (F)


The cuvette for holding the absorbing solution.(C). Barrier - type photocell (P). 


Working: 

The cuvette is first filled with an appropriate blank (solvent) and placed in the optical path. The incident light intensity is adjusted so as to obtain reading 100% transmittance or zero absorbance. After this adjustment, the cuvette is filled with the sample solution and placed in the optical path. It's percentage transmittance( %T) or absorbance (A) is measured. The concentration of the sample solution can be determined using Beer-Lambert's equation. 


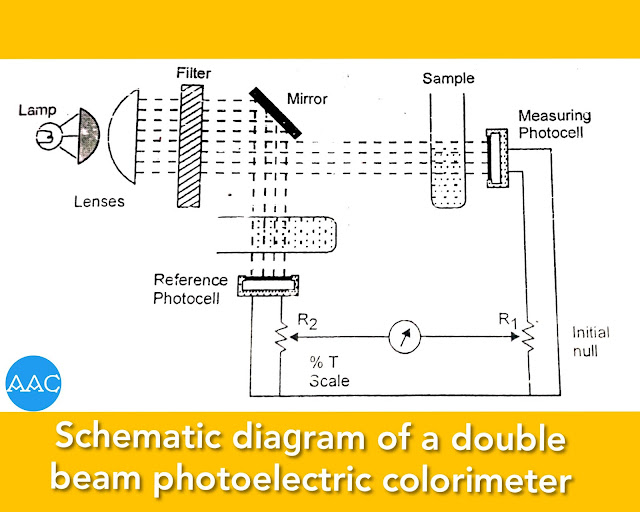
Double beam photoelectric colorimeter

In order to operate this instrument, the null balance galvanometer is adjusted mechanically to bring the needle at mid scale with the lamp OFF. Then, the lamp is switched ON and blank solution is kept in both light beams.  

Double beam photoelectric colorimeter.

The potentiometer dial R₂ is adjusted to read 100% transmittance and then the slide-wire contact R₁ is adjusted to null the galvanometer. Standard and unknown solutions are introduced into the measurement beam and slide-wire contact R₂ is adjusted to renull the meter. The transmittances (linear) or absorbance (non-linear) can then be read out from the potentiometer dial for each sample. 


Advantage of Double Beam Instruments

  1. Although the double beam instruments are more complicated and expensive, they do offer the following advantage:

  2. It is not necessary to continually replace the blank with the sample or to adjust zero absorbance at each wavelength as in single beam units. 

  3. The ratio of the powers of sample and reference beams is constantly obtained and used. Any error due to variation in the intensity of the source and fluctuation in the detector is minimized. 

  4. Because of the previous two factors the double beam system tends itself to rapid scanning over a wide wavelength region and to the use of a recorder or digital readout. 


Spectrophotometry 

Colorimetrically technique suffers from certain disadvantages like limited utility, low sensitivity etc, which have been removed in spectrophotometry. Development of this technique is discussed in details. 

In a photoelectric colorimeter, a light filter has been placed after the source of white light. The radiations emerging from the filter have wavelengths within a small range known as wave band. The band width is about width 20 nm to 50nm. 

If a light filter is replaced by a device known as monochromator, we can have a beam of radiations of particular wavelength i.e. a beam of monochromatic radiations. This has a band width of less than 1nm.


In filter photometer the bandwidth is more and due to this it has two disadvantages. 

  1. True absorption curve cannot be obtained. 

  2. Beer's law is not followed in true sense. 

In order to remove these difficulties, in spectrophotometer meter, monochromator is used which may be prism of diffraction grating or an interference wedge together with two narrow slits. Any one of them is capable of isolating a much narrow band of wavelength (1nm). 


The amount of light reaching the detector of spectrophotometer is generally much smaller than that available for a colorimeter, because of it the small spectral bandwidth. Therefore a more sensitive detector is required. 


A photomultiplier or vacuum photo-cell is used instead of photometer. 


As the technique is applicable to visible,UV and IR regions, different source of radiation are used. 


Spectrophotometer

It is a combination of spectrometer and photometer. The function of spectrometer is to provide a beam of radiation of a selected wavelength and that of photometer is to measure the intensity of the transmitted radiation. 

Single beam spectrophotometer.

The essential parts of spectrophotometer are-

  1. Source of radiation:

The source is used in a spectrophotometer are tungsten halogen lamp in visible region (380 to 780 nm), hydrogen discharge tube for UV region and deuterium lamp (190-375 nm) or Nernst Glower for IR region. 


  1. Monochromator:

Light from the radiation source is allowed to pass by means of a lens (L) through a narrow slight (T) and then reflecting mirror M on to an optical grating G or a prism, which divides light into narrow spectral regions corresponding to different wavelengths. 


  1. Absorption cell: 

The light of a desired wavelength emerging from the grating is allowed to pass through the cuvette B containing solution under examination. For studies in visible region, the cell made up of corex glass is used while for UV region, a quartz cell is applied. 


  1. Detector:

The light coming out of the solution after absorption, is allowed to fall on the detector D. The role of detector is to respond to the intensity of radiation. In spectrophotometer generally photo multiplier tubes are used as detector. 


  1. Indication:

A galvanometer records the intensity of the light falling on the photoelectric cell. 


Double-beam spectrophotometer

Double-beam spectrophotometers has a beam splitter like chopper that splits the beam obtained from source into two components of equal intensity. One beam passes throughout the solvent while the other through sample cell. The difference is recorded by the photomultiplier tube. All the other components are similar to single beam instrument. Schematically, it can be shown as follows-

Double beam spectrophotometer.

Application of Colorimetry and 

spectrophotometry in quantitative 

inorganic analysis. 

Colorimetric and spectrophotometric techniques use Beer-Lambert's law as a basis for quantitative determination of a species in solution. In quantitative chemical analysis of any substance, following steps are involved. 


  1. Development of colour:

If the species to be analyzed colorimetrically is colourless, it is treated with suitable reagent that imparts colour to the solution. This reagent is added in excess of the species under study. Also, this reagent should not absorb at the same wavelength. Such colour development is not required in spectrophotometry, provided, the species absorbs in either visible or UV region. 


  1. Determination of λ max:

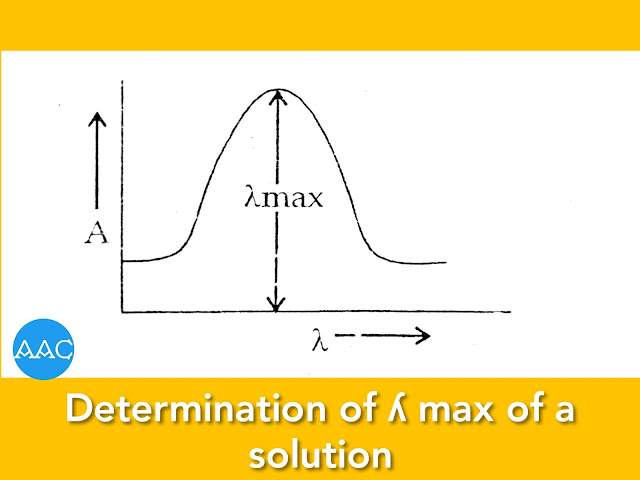
The wavelength at which the substance absorbs maximum is called as λ max. At this wavelength, the value of molar absorptivity is maximum and hence the sensitivity is maximum. It is determined by recording absorbance of any of the standard solutions of the species under study at different wavelengths. 


In case of colorimeter, it is not possible wavelength linearly. So, absorbance is recorded using different filters. A graph is plotted between absorbance and wavelength. Maxima of this graph corresponds to λ max (Figure).

Determination of ʎ (lambda) max of a solution.

  1. Preparation of calibration curve:

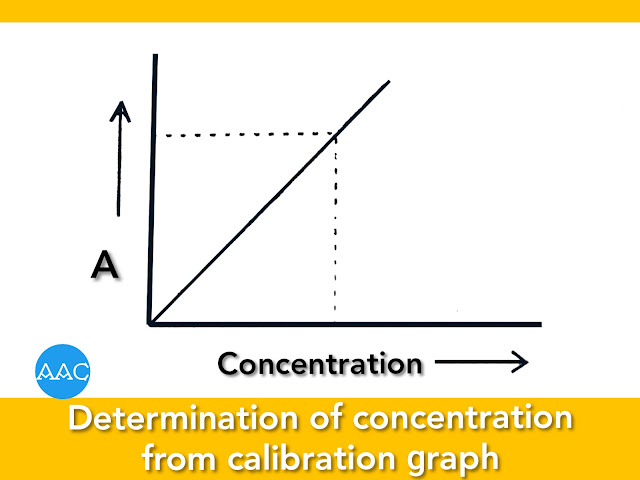
A series of solutions containing different concentrations of species under study is prepared and absorbances are recorded at wavelength selected previously. A graph is plotted between concentration of the species and absorbance. It is a straight line passing through origin and called as calibration graph. 


  1.   Estimation of concentration of analyte:

Sample is treated in the similar manner as that of the series of standards. Colour is developed and absorbance e recorded at the wavelength. From calibration graph, concentration of the analyte can be determined as shown in figure. 

Determination of concentration from calibration ɡraph.


Estimation of copper as copper-ammonia complex


Principle:

A series of standard solutions of copper sulphate penta hydrated is treated with ammonia to get blue cuprammonium complex, and is diluted to a definite volume. The absorbance of each of these solutions is measured at 590 nm since the complex shows maximum absorbance at this wavelength. The absorbance values are plotted against concentration to get a calibration curve. 

The analysis involves following steps-


1.  Preparation of standards:

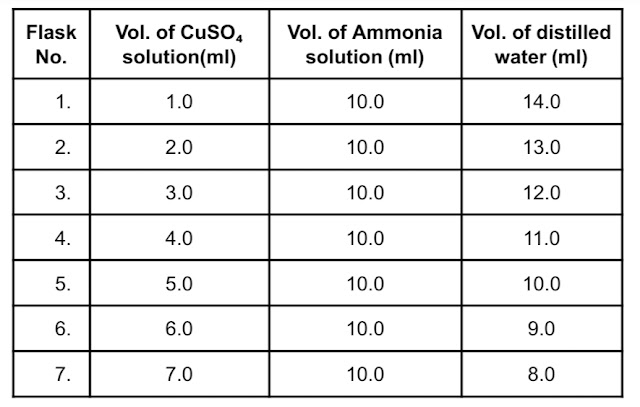
A  0.01M copper sulphate solution is prepared in distilled water maintaining slightly acidic condition to avoid hydrolysis of copper sulphate. This can be achieved by adding a few drops of sulphuric acid solution. A series of standards is prepared by taking different volumes of CuSO₄ solution in 25 ml volumetric flasks. 


2.  Development of colour:

To each of the volumetric flasks, 10 ml of 1:1 ammonia is added to develop the colour and volume is made up of 25ml with distilled water. 

Estimation of copper as copper-ammonia complex.


3.  Determination of λ max:

The wavelength at which the substance absorbs maximum is called as λ max. At this wavelength, the value of molar absorptivity is maximum and hence the sensitivity is maximum. It is determined by recording absorbance of any one of the above systems. 

In case of colorimeter, it is not possible wavelength linearly. So, absorbance is recorded using different filters. A graph is plotted between absorbance and wavelength. Maxima of this graph corresponds to λ max (Figure). For copper ammonia complex, it is 590 nm. 

Determination of lambada ʎ max of a solution,copper-ammonia complex.

4.  Preparation of calibration curve:

Absorbances are recorded at wavelength selected previously. A graph is plotted between concentration of the species and absorbance. It is straight line passing through origin and called as calibration graph. 


5.  Estimation of concentration of analyte:

Sample is treated in the similar manner as that of the series of standards. Colour is developed and absorbance e recorded at the wavelength. From calibration graph, concentration of the analyte can be determined as shown in figure. 

Determination of concentration from calibration graph, copper-ammonia complex.

Difference between colorimeter

 and spectrophotometer. 


Colorimeter

  1. In a photoelectric colorimeter colour filters are used to select desired wavelength. 

  2. The radiations emerging out from the filters have wavelength within a small range. (Band-width is 20 to 50 nm). 

  3. In colorimeter a photoelectric device used as detector is photocells. 

  4. They are used in only visible region. 

  5. Deviations from Beer-Lambert's law are observed. 

  6. Colorimeters are generally used for the quantitative analysis of coloured substances. 


Spectrophotometer

  1. In spectrophotometer, a mono-chromator is used to select desired wavelength. 

  2. The radiations emerging out from the monochromator have very narrow wavelength range. (Band width is <1nm.)

  3. In spectrophotometer, photo multiplier tubes or high vacuum photo missive cells are used. 

  4. They are used in visible, UV and IR regions. 

  5. Beer-Lambert's law is perfectly obeyed. 

  6. Spectrophotometers are mostly used for the structure elucidation of colourless and coloured substances in addition to quantitative analysis. 


Ion exchange chromatography, Types of ion-exchange resins, determination of ion exchange capacity, factors affecting ion-exchange equilibrium and ion exchange applications.

All About Chemistry

Ion exchange may be defined as " a reversible exchange of like ions between solid phase and liquid phase in which there is no permanent change in structure ". This technique is sometimes called as ion exchange chromatography. 


Principle

Ion-exchange technique is carried out using special material called as ion-exchange resin. 

These resins are insoluble organic polymers into which charged groups are introduced. The base polymer is generally styrene-divinyl-benzene copolymer. The resin contains some ionic sites where exchange of ions can take place. These sites may be cationic or anionic. When ions in the solution come in contact with these ions, they displace these ions from their positions and the solution coming out of the column contain ions of the resin. 

After complete separation of ions on resin, one of the ion is eluted out with the help of suitable solvent. Other ions remain intact on the resin. Changing the solvents one by one , each ion in the mixture can be eluted out selectively.


Types of ion-exchange resins

Ion-exchange resins are the insoluble organic polymers with charged groups attached at suitable positions. The charged group determines the type of resin. Ion-exchange resins are two types:

  1. Cation exchanger :

Cation exchanger is a high molecular weight, cross linked polymer having sulphonic, carboxylic, phenolic etc groups as main groups and equivalent number of cations are attached to them. These cations are active ions and can be exchanged with the cations in solution. Generally, they are used in H+ or Na+ form. 

For cation exchanger in H+ form, the ion exchange equilibrium can be shown as,


HnR   + nNa+   ⇌ NanR + nH+

             (Resin)    (Solution)   (Resin) (Solution)


For cation exchange in Na+ form the ion exchange equilibrium can be shown as


           2NanR  + nCa++  ⇌ CanR₂ + 2nNa+

     (Resin)       (Solution) ( Resin)    (Solution)


Cation exchangers may be further classified into strongly acidic and weakly acidic exchanger. In strongly acidic cation exchanger like cross linked polystyrene sulphonic acid (-SO₃H), the ion exchange capacity is  independent of pH. However, in case of weakly acidic cation exchangers like those containing -COOH group, basic conditions have to be adjusted so as to enhance ion exchange capacity. 


  1. Anion exchanger:

Anion exchangers are polymers having amine or quaternary ammonium groups as integral parts of the resin and equivalent number of anions like chloride, sulphate,Anion exchange equilibrium can be shown as 


RCln   + nOH-    ⇌ R(OH)n +  nCl-

                   (Resin)   (Solution)       (Resin) (Solution)   


This can also be classified into strongly basic and weakly basic exchangers. Strongly basic resins containing quaternary ammonium groups act independent of pH while activity of weakly basic resins is high in acidic conditions. 


Ion exchange capacity

The total ion exchange capacity of a resin is dependent upon the total number of ion-active groups per unit weight of material. Greater is the number of active groups greater is the exchange capacity. 

Ion-exchange capacity is defined as the number of millimoles of exchangeable groups per gram exchanger. For acidic resin, it is determined in laboratory by measuring the number of milligram moles of sodium ions absorbed by 1 g of dry resin in hydrogen form. For basic resins, it is determined by measuring the number of milligram moles of chloride ions absorbed by 1 g of dry resin in hydroxide form. 


Determination of ion exchange capacity

  1. In actual practice, about 0.5 g of dried resin (in hydrogen form) is accurately weighed and transferred to a column partly filled with distilled water. Some more distilled water is added so that the resin is completely covered. Care is taken to remove any air bubble on the resin.

  2. With the help of separatory funnel, about 200 ml of 0.25 M sodium sulphate solution is dripped into the column at a flow rate of about 2 ml per minute. 

  3. During this process, hydrogen ions of resin get exchanged with sodium ions of solution and get eluted out. 

HnR   + nNa+     ⇌ NanR +  nH+

                 (Resin)    (Solution)       (Resin) (Solution)

  1. The eluent is titrated with 0.1 M sodium hydroxide solution using phenolphthalein indicator. From the concentration of hydrogen ions and weight of resin taken, one can calculate ion exchange capacity as follows. 

Ion-exchange capacity=NV

                                        W


N is the normality of NaOH solution, V is volume of NaOH solution and W is weight of resin. 

  1. For anion exchange resin in chloride form, 0.25 M sodium nitrate is used to exchange chloride ions with nitrate ions as 

RCln  + nNO₃−  ⇌ R(NO₃)n +  nCl-

It is  titrated with 0.1 M silver nitrate solution using potassium chromate indicator. 


Factors affecting ion-exchange equilibrium

The extent to which one ion is absorbed in preference to other is of fundamental importance. It will determine the readiness with which two or more substances, which form ions of like charge, can be separated by the resin . The factors determining the distribution of inorganic ions between the ion exchange resin and solution are- 

1.  Nature of exchanging ions 

A)  Charge on ion: 

At low concentration of solution, the extent of exchange increases with in charge on ion. That is, the extent of exchange follows the order

Na+  < Ca2+ <  Al3+ < Th4+


B)  Size of hydrated ion:

When charge on ions is same, the extent of exchange decreases with increase in size hydrated ion. For singly charged cations, the extent of exchange follows the order

 Li+ < H+  < Na+ < NH₄+  < K+ < Rb+ < Cs+


It should be noted that the size of hydrated ion of lithium is largest and so exchange ability is minimum. 


C)  When charge on ion in the solution is higher than that in the resin, dilution of the solution increases the extent of exchange. When charge on ion in the solution is lower than that in the resin, concentration of the solution increases the extent of exchange. 


2.   Nature of resin

Absorption of ions depends upon the nature of functional groups in the resin.  It also depends upon the degree of cross linking. As the degree

of cross linking in the resin increases, the resin 

becomes more selective towards the ion whose

effective size is smaller (Effective size includes the increase in size due to hydration). A good resin        should posses following properties-.     

  1. It must be sufficiently cross-linked and should have negligible solubility. 

  2. It should be sufficiently hydrophilic to permit diffusion of ions at finite rate. 

  3. It should contain sufficient number of exchangeable groups. 

  4. Swollen resin should have higher density than water. 

Some of the commercially available resins are listed in table 


Applications

Being a separation technique, ion-exchange chromatography is used in separation of multicomponent mixtures. Some applications involving separation of binary mixtures are discussed in details. 

  1. Separation of chloride and bromide:

An anion exchange column is converted into nitrate form by passing concentrated NaNO₃ solution. Concentration solution oy mixture of chloride and bromide is added from the top of the column. The halide ions exchange with nitrate ions in the resin forming a band at the top of the column. These ions are eluted by adding NaNO₃ solution from top. Chloride ions are eluted first and then bromide ions come out. The fractions are titrated with standard silver nitrate solution using adsorption indicators. Thus, it is possible to calculate concentration of Cl- and Br- ions in the mixture. 

  1. Separation of zinc and magnesium:

For separation of zinc and magnesium, they are converted into their chloro Complex [ZnCl₄]²−. The mixture of these Complexes is poured from top of an anion exchanger column. Magnesium is eluted using 2M HCl. Zinc remains in the column when HCl is added. After complete collection of magnesium, zinc is eluted using 0.25 M HNO₃ . Further analysis of the separate solutions is possible using complexometric  titration using EDTA. 


  1. Separation of cadmium and zinc:

Cadmium and zinc from strong chloro Complexes with HCl. They are negatively charged and can be separated by using anion exchanger. The mixture is added to anion exchange column zinc is eluted first with 2M NaOH solution containing NaCl. It comes out of the column in the form of sodium zincate (Na₂ZnO₂). After complete elution of zinc, cadmium is eluted with 1M HNO₃ solution in the form of cadmium nitrate. The zinc and cadmium in their respective effluents may be determined by titration with standard EDTA. 


  1. Separation of Lanthanides: 

Lanthanides series elements occur in nature in various ores. These ores contain almost all lanthanides together. Separation of these lanthanides is difficult task, as they resemble in most of their properties. They have almost similar size and all of them exist in +3 oxidation state. So, they have equal charge density. 


Ion exchange technique is the most rapaid and effective general method for the separation and purification of lanthanides. The mixture of lanthanides is poured into a cation exchanger column of Dowex -50 in hydrogen form. They get exchanged with hydrogen ions as-

Ln³+    + 3HR ⇌   LnR₃ + 3H+


They are eluted using ammonium citrate-citric acid buffer. The smaller lanthanide ions like La³+,Ce³+ etc form strong complex with citrate ion and eluted out first while larger lanthanide ions like Lu³+ are eluted latter. 

       LnR₃  + 3H+    + (Citrate)³-  ⇌3HR + Ln(Citrate)


  1. De-ionization of water: 

De-ionization of water is carried out by passing natural water through two columns. First column is of acidic cation exchanger in hydrogen form. This column replaces all cation with H+ ions. Second column is of basic anion exchanger in hydroxide form. This column replaces all anions with OH-. These H+ and OH- ions combine to give pure water. 


  1. Separation of Na+ and K+:

Separation of sodium and potassium ions can be achieved by passing their solution through cation exchanger in acidic form. Elution is carried out using 0.7 M hydrochloric acid solution. Sodium, being less firmly held , move down the column more rapidly while potassium elutes out afterwards. From these solutions, solvent is evaporated and the chloride salts are redissolved in water.   Mohr's titration with AgNO₃ is used for analysis. 


  1. Separation of Ni²+ and Co²+:

This separation can be achieved using strong base anion exchange resin. Solution of the ions is prepared in 9M HCl solution in which Co²+ form a chloro Complex [CoCl₄]²− but nickel does not. This Complex is retained by the resin while Ni²+ passes unaffected. After complete elution of Ni²+, Co²+ is eluted using 3M HCl. The separated solution can be analyzed colorimetrically. Nickel is estimated using DMG while cobalt is estimated using 1-nitroso-2-napthol.